
Paws Chicago
Project Overview:
The project, "Revamping the PAWS Chicago Website for Enhanced User Experience," aimed to improve the usability and information architecture of the PAWS Chicago non-profit organization's website. The project was conducted as part of the HCI 457: Information Architecture and Content Strategy course, led by a team consisting of Deepthi Rajagopal, Sravani Cherukuri, and Zishi Li.
Problem Statement
PAWS Chicago's website, while critical for connecting with donors, volunteers, and potential pet adopters, faced several challenges:
Poor navigation and information architecture.
Inefficient content organization.
Low engagement due to usability issues.
Difficulty in finding key information.
Challenges
The project encountered various challenges throughout its execution:
Ambiguous Content Labels: Initial card sorting revealed ambiguity in content labels, making it challenging to create an effective information architecture.
Navigation Issues: Treejack testing exposed issues with task completion rates, highlighting the need for improved website navigation.
Resource and Time Constraints: Limited resources and time constraints impacted the depth and scale of usability testing, requiring careful allocation of efforts.
Research & Discovery
Content Inventory
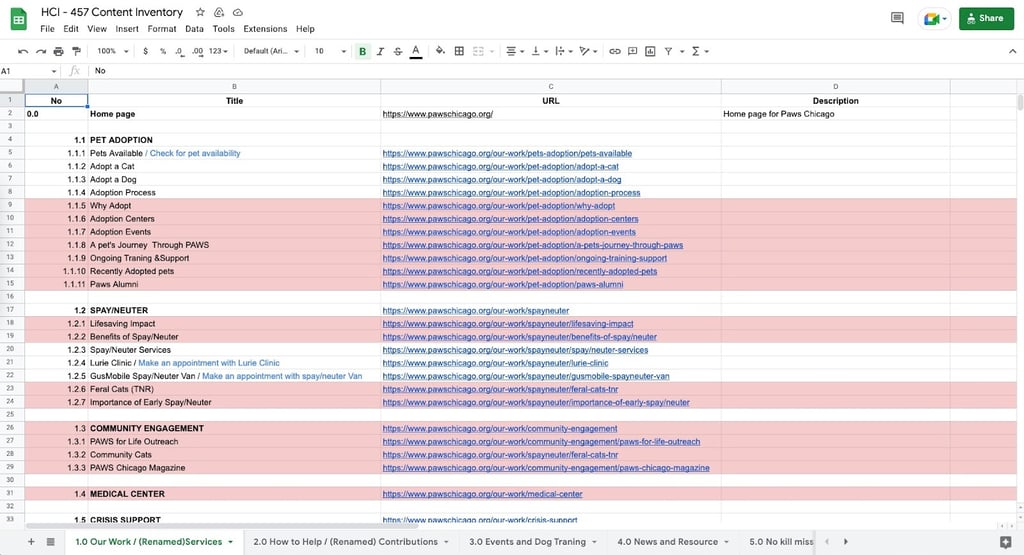
Conducted a comprehensive content inventory to understand the existing content structure. The content inventory helped us simplify the navigation of the application. We combined categories and renamed them to avoid redundancy. We worked on bringing important information to the top of the navigation tree so it's easily accessible. Below is a snippet of our content inventory.

Card Sorting
Performed two rounds of card sorting to iteratively improve content categorization and labels. Friends and students helped to recruit the participants. Each card sorting included between 10 and 15 participants, and all of the card sorting was done on a desktop, laptop, and iPad.
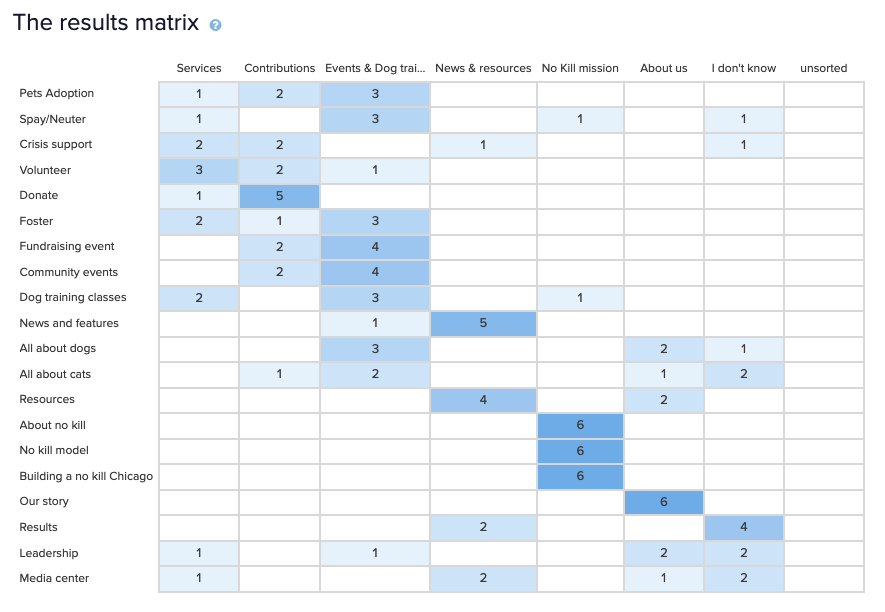

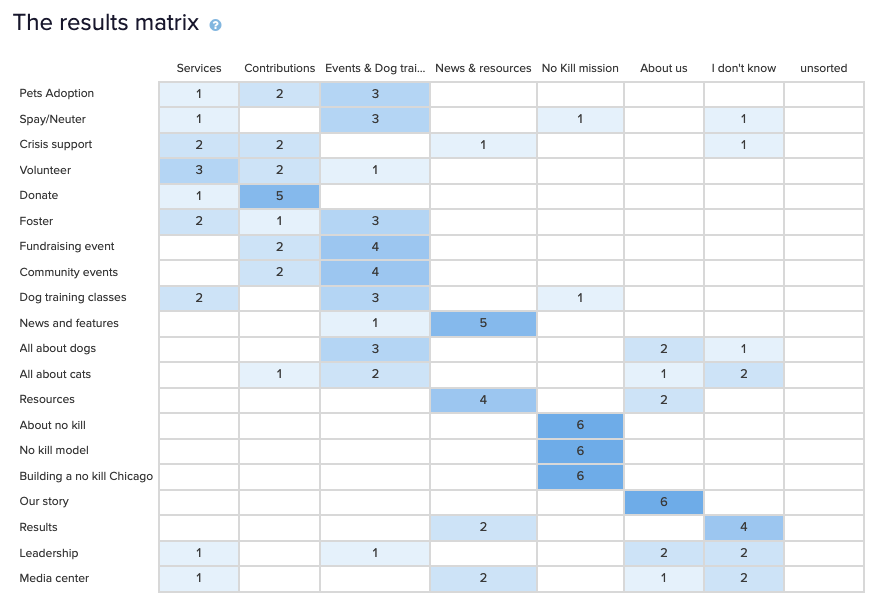
The First Round of Card Sorting Results:
The first round of card sorting went a little differently than we expected. The names of the cards were unclear, making it difficult for consumers to navigate them properly.
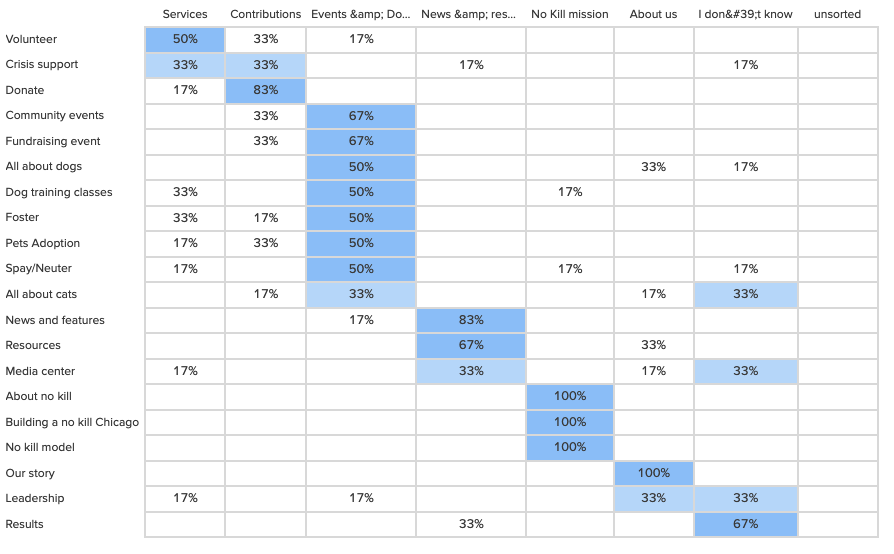

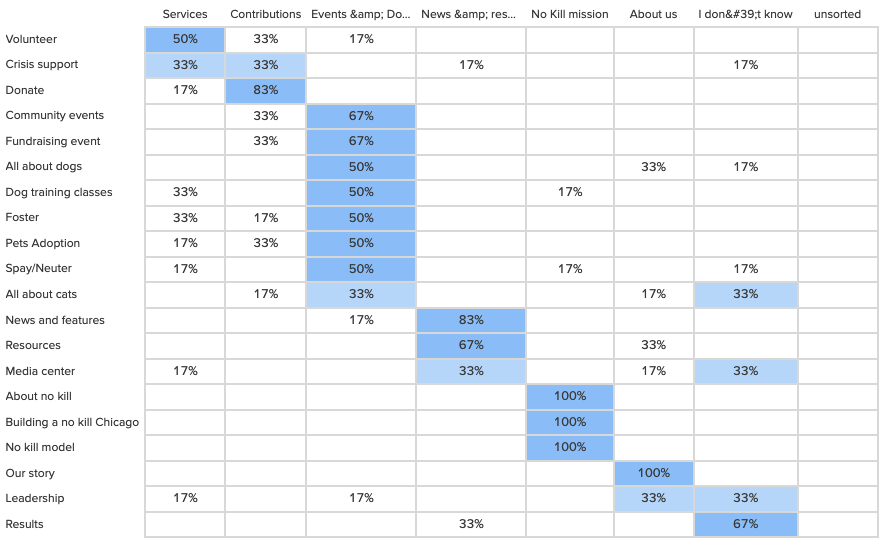
The Second Round of Card Sorting Results:
We chose to simplify our categories and clarify the names of the cards after the first round of card sorting. In the second card sort, we have achieved our goal of having over 60% to 100% success rate in the correct categories.


Tree jack
Evaluated the website's navigation using tree-jack testing to measure the find-ability of key tasks. We conducted one round of tree-jack testing. The participants were recruited using friends and family connections. A total of six participants completed the test. Overall, 60% of participants successfully completed the test, and 73% completed it directly without backtracking.
Tree jack testing results:
If you would like to adopt a dog, where would you click?
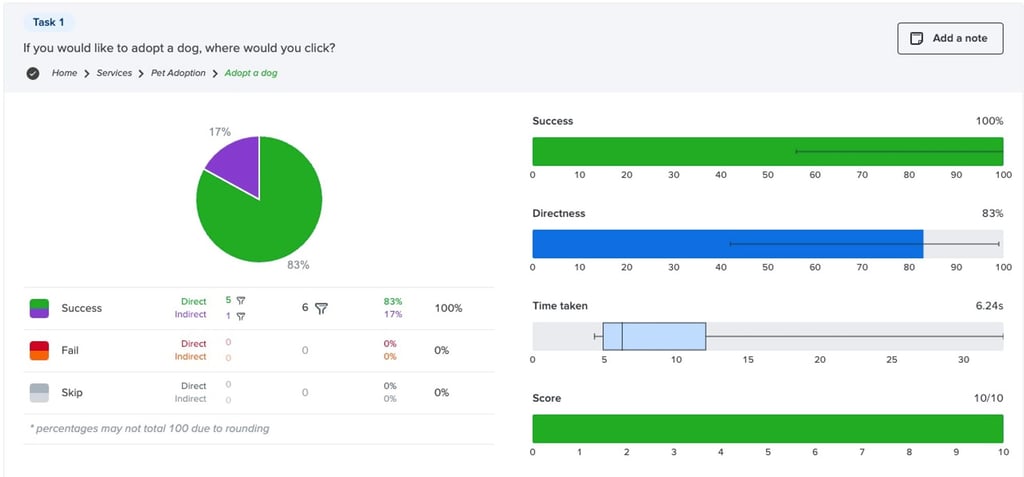

This was an important task for the website, and the results were promising, with 100% success.
Where would you find a pet to foster?
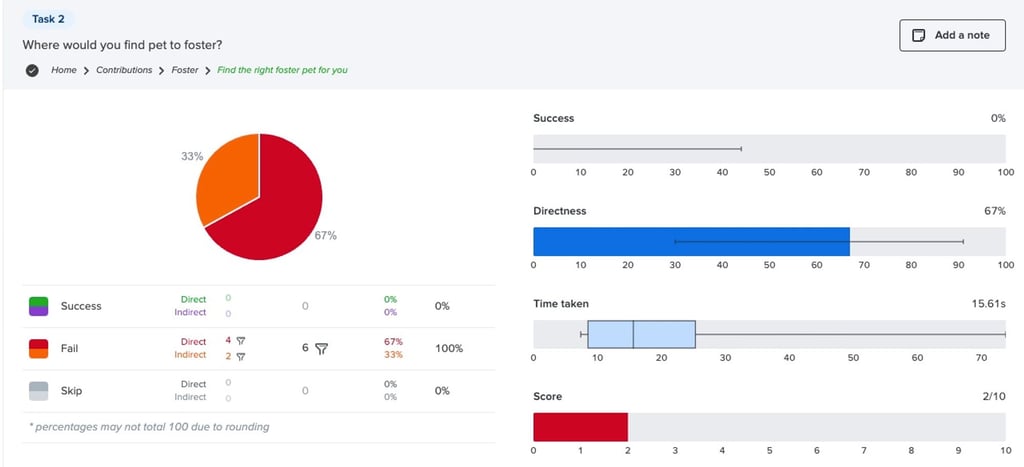

This task was a complete failure. On checking the pie, the participants have taken a navigation path of 'services' rather than 'contributions’ to find the right foster pet for themselves.
How would you make a corporate donation?
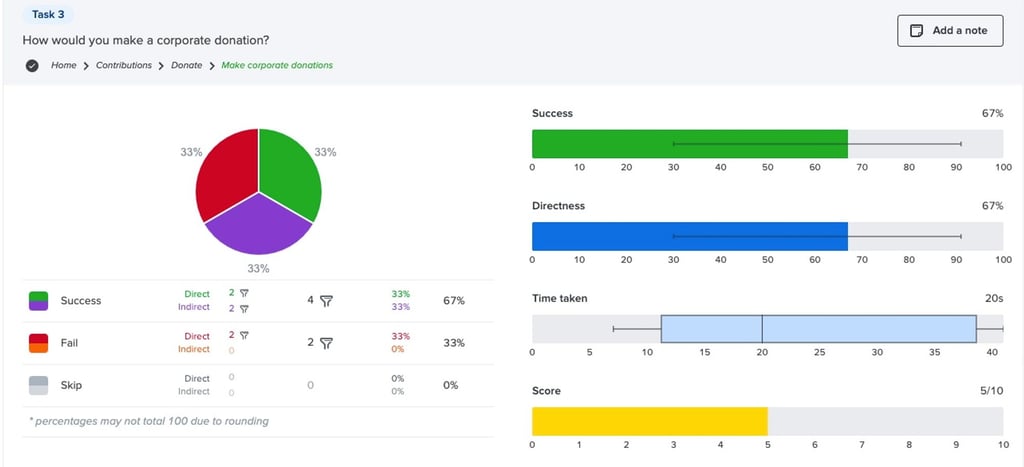

This task had a total success rate of 66%, including direct and indirect paths, with a 33% failure rate. It is notable that the highest time taken for this task is more than other tasks.
How would you learn more about medical care for dogs?
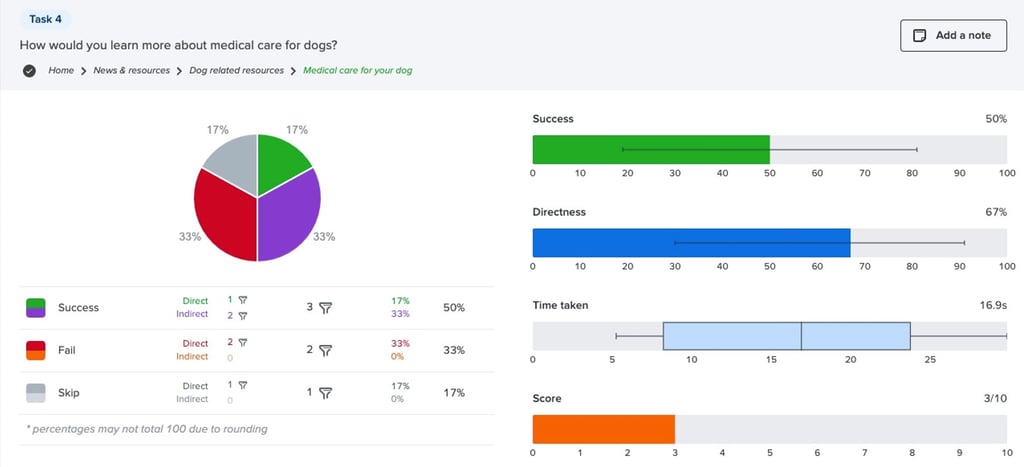

This task had a 50% success rate and 67% direct success. The results show that the other 50% were confused or skipped this task.
How would you sign up to volunteer?
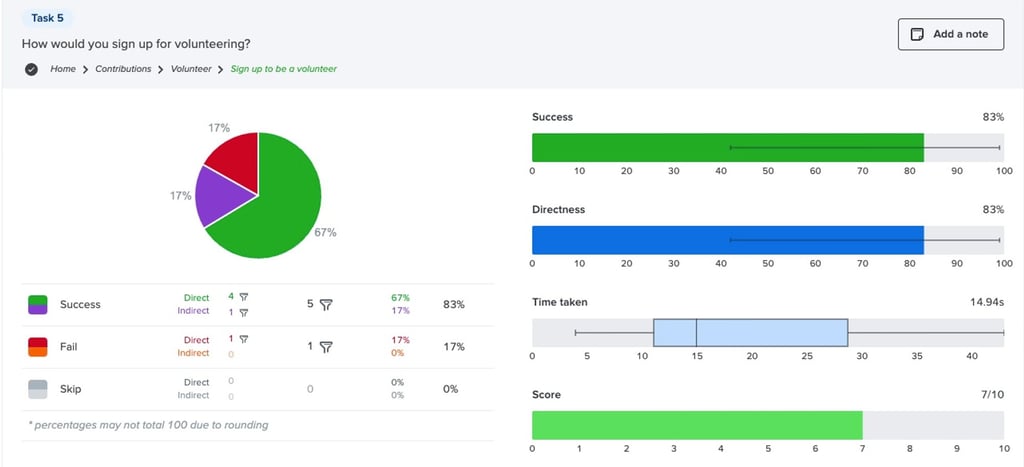

This task had a 67% success rate and 83% direct hits. The results show that only 17% were confused or failed the task. This task is one of the key tasks of the application.
Quantitative research was crucial in assessing user preferences and improving the information architecture. It provided data-driven insights into the effectiveness of the website's navigation.
Quantitative Research:
Competitive Analysis:
Conducted a competitive analysis to benchmark PAWS Chicago's website against other non-profit and animal welfare organization websites. This analysis helped identify best practices and areas for improvement.
User Research: Conducted interviews and surveys to understand user needs, motivations, and pain points.
Competitor Analysis: Analyze the websites of other animal welfare organizations to identify best practices and potential opportunities.
Information Architecture
Based on the research findings, the Define phase involved:
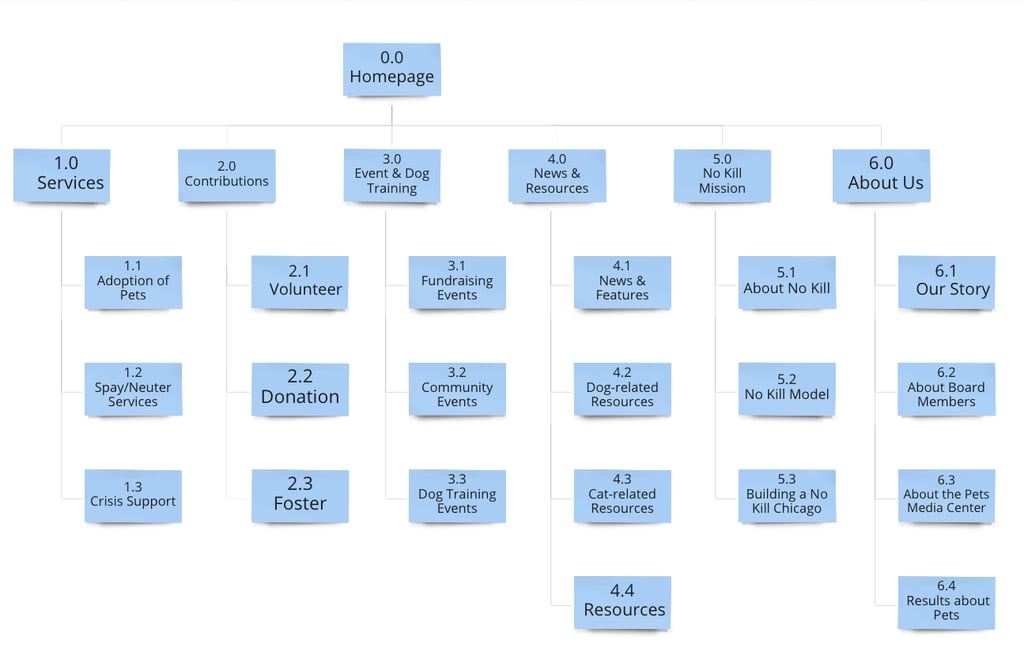
Created multiple versions of the sitemap to improve website navigation and information architecture. The following is the most recent edition of our sitemap. Because of the misunderstanding between functional activities and navigation, we changed our sitemap multiple times. This version achieved the most satisfactory card sorting results after a few rounds of card sorting. As a result, towards the end, we opted to make our sitemap as simple as feasible.
Sitemap Development:

Wireframing and Prototyping
Wireframe
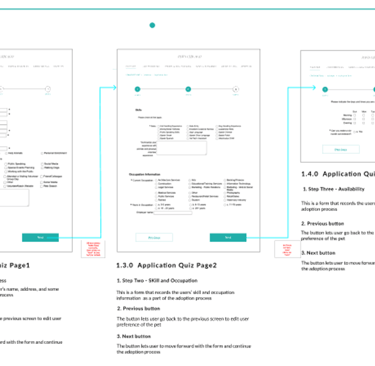
Task 1 : Adopt a pet
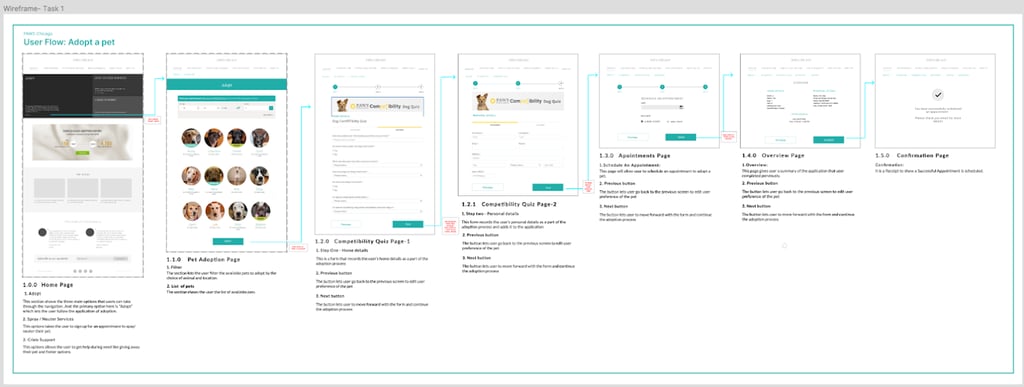

The Wire framing Process:
A user views the home page, decides to adopt a pet, and then clicks "Adopt."
After using the filter and getting the list of his/her ideal pets, the user picks his/her favorite one and clicks “next” to start the application
Following the guidance shown above, the user completes the quizzes step-by-step.
An overview and a confirmation will be shown at the end of the application.
The reason why we chose the first task is that we believe some people who could have adopted an animal have quit because of the complicated process. We hope we can make it more friendly for most people. While designing the new process, there were many tradeoffs. Over easy process might have potential risks that adopted pets will be dropped again, and a complicated process will reduce people's interest. In the end, we simplified the online process to attract more people and designed an onsite face-to-face interview to help the organization make a final decision.
Task 2: Volunteering opportunities at the shelter

The wire framing process:
A user views the home page, decides to volunteer, and then clicks "volunteer.”
After picking the field the user is interested in, a list of relevant activities is displayed.
The user selects one of the items.
Following the guidance shown above, the user finishes the quizzes step-by-step.
An overview and a confirmation will be displayed at the end of the application.
The second task that we chose is “volunteering opportunities at the shelter” because the information and navigation structure in the original webpage are confusing and disordered. We wanted to improve it so that people who want to volunteer would find the most appropriate activity for them. By applying the cards, shown in screen 2, it is easier for people to acquire information about the volunteering opportunities at the shelter.
Usability Testing
Usability testing of wireframes
You would like to adopt a pet. Where would you go?
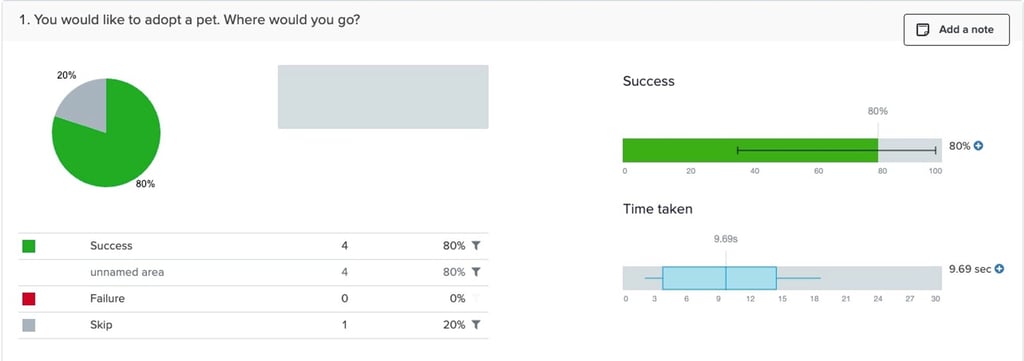

Our team was happy about the 80% success rate of this test. It was easy for participants to choose the adoption link on the page.
You would like to filter your choice of pets. Where would you go?
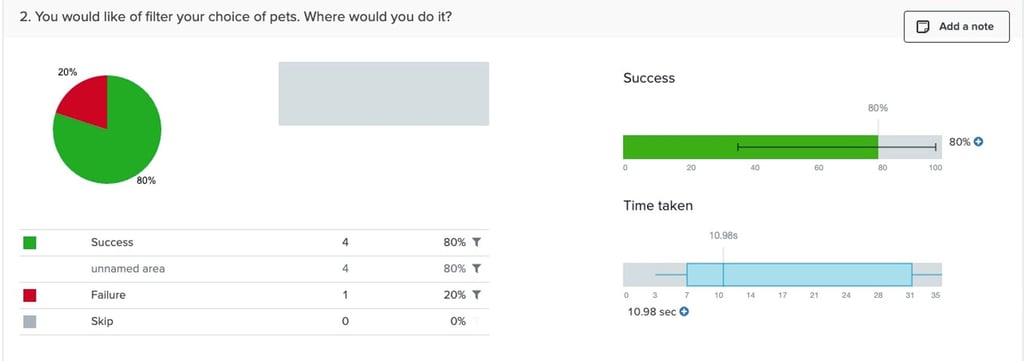

This task had the highest success rate, as participants found it easy to find the filter option.
Where would you go to find volunteering opportunities?


For this task, one participant skipped and failed the task. But overall, the task was only 60% successful and did not meet the expectations of the team.
User-Centered Approach: A user-centric approach is paramount for improving user experience and engagement on non-profit websites.
Iterative Design: Iterative processes, such as card sorting and usability testing, are critical for refining website design and functionality.
Quantitative Data: Quantitative research provides valuable data for making informed design decisions.
Competitive Analysis: Benchmarking against competitors helps identify areas for improvement and best practices.


